Natural hazards
Type of resources
Keywords
Publication year
Topics
-
<div>These videos are part of a series to provide tutorials in how to use the Earthquakes@GA portal in the classroom. They include guides for basic navigation, how to access summary data for recent earthquake events and how to make a felt report. They also demonstrate how to use the Search function to collect historic earthquake data across a range of criteria including location (both within Australia and across the world), date and time, and magnitude.</div><div>Videos included:</div><div>- Introduction to using the Earthquakes@GA data portal</div><div>- How to use the Search function in the Earthquakes@GA data portal</div><div><br></div><div>They are suitable for a secondary to senior secondary student and teacher audience.</div>
-
This National Wind Risk Assessment (NWRA) has been undertaken as a component of the National Climate Risk Assessment, which is led by the Department of Climate Change, Environment, Energy and Water (DCCEEW) and drawing upon the expertise in the Australian Climate Service. The NWRA sits alongside similar risk assessments for flood and peri-urban bushfire hazards. This report provides a summary of the workflow, the contributing elements and a cursory analysis of the resulting risk metrics and is intended for downstream users of the data to understand it’s derivation. A more detailed examination of the results is to be completed at a later date. The NWRA is a quantitative evaluation of the likelihood and magnitude of the physical impacts to the built domain arising from severe wind events. The focus of the assessment is residential separate houses, due to the limited scope of required data to calculate the impacts of these events. It is anticipated that the NWRA will represent one of the most advanced assessments performed in the NCRA, as the available information enables us to work through the hazards, exposed assets, and their vulnerabilities to quantify the impacts from severe wind events. This dataset provides estimated Average Annual Loss values for all ASGS (2021) SA1 regions, based on the wind impacts to residential separate houses. The analysis workflow is fully described in the accompanying document.
-
<div>These two videos provide tutorials on how to use the Digital Earth Australia (DEA) portal in the classroom. They include guides for basic navigation, how to load a data set (DEA Landcover) and how to compare different dates within a data set. Additionally, they also show how to share your data via either a share link, image or as an interactive ‘Story’ of saved scenes.</div><div>Videos included:</div><div>- Introduction to using the Digital Earth Australia (DEA) portal</div><div>- Exploring land cover data using the Digital Earth Australia (DEA) portal</div>
-
<div>These videos provide tutorials on how to use the Geoscience Australia Data portal in the classroom. They include a guide for basic navigation, how to load 2D map data sets (elevation, surface geology and critical minerals) as well as accessing a 3D data model (earthquakes). Additionally, they demonstrate how to directly compare multiple data and how to share collated data through a shareable link.</div><div>Videos included:</div><div>- Introduction to using the Geoscience Australia Data Portal (2:15)</div><div>- How to access elevation, surface geology and critical minerals data in the Geoscience Australia Data Portal (4:26)</div><div>- How to view the global distribution of earthquakes using the Geoscience Australia Data Portal (2:51)</div><div><br></div><div>These videos are suitable for use by secondary students and adults.</div>
-
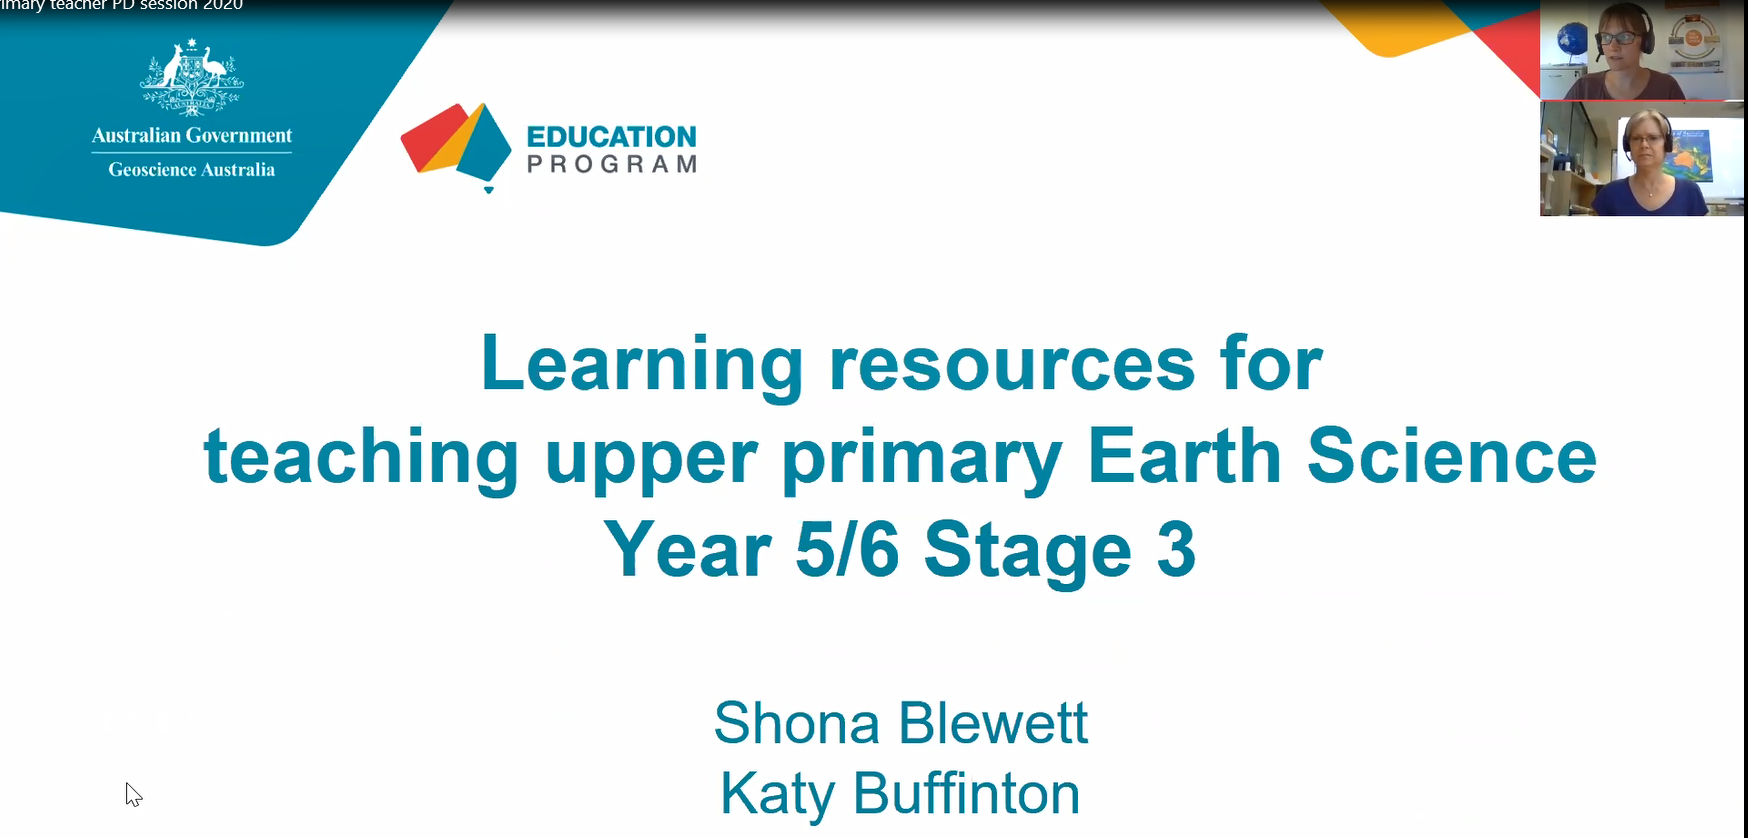
Videos of our primary professional learning sessions: Year 3-4 Stage 2 (middle primary): This session focussed on ‘Earth’s surface changes over time as a result of natural processes and human activity’. The activities emphasised practical investigations of weathering and erosion processes. 30 minutes long. Year 5-6 Stage 3 (upper primary): This session focused on teaching about ‘Sudden geological changes and extreme weather events that can affect Earth’s surface’. Geohazards were the main topic covered and suggested activities to undertake with students were demonstrated. 50 minutes long. These sessions are recordings of Zoom presentations. The accompanying PowerPoint slides are available for download, the presentations also include demonstrations of hands on activities. <p>
-
<div>This data package contains interpretations of airborne electromagnetic (AEM) conductivity sections in the Exploring for the Future (EFTF) program’s Eastern Resources Corridor (ERC) study area, in south eastern Australia. Conductivity sections from 3 AEM surveys were interpreted to provide a continuous interpretation across the study area – the EFTF AusAEM ERC (Ley-Cooper, 2021), the Frome Embayment TEMPEST (Costelloe et al., 2012) and the MinEx CRC Mundi (Brodie, 2021) AEM surveys. Selected lines from the Frome Embayment TEMPEST and MinEx CRC Mundi surveys were chosen for interpretation to align with the 20 km line-spaced EFTF AusAEM ERC survey (Figure 1).</div><div>The aim of this study was to interpret the AEM conductivity sections to develop a regional understanding of the near-surface stratigraphy and structural architecture. To ensure that the interpretations took into account the local geological features, the AEM conductivity sections were integrated and interpreted with other geological and geophysical datasets, such as boreholes, potential fields, surface and basement geology maps, and seismic interpretations. This approach provides a near-surface fundamental regional geological framework to support more detailed investigations. </div><div>This study interpreted between the ground surface and 500 m depth along almost 30,000 line kilometres of nominally 20 km line-spaced AEM conductivity sections, across an area of approximately 550,000 km2. These interpretations delineate the geo-electrical features that correspond to major chronostratigraphic boundaries, and capture detailed stratigraphic information associated with these boundaries. These interpretations produced approximately 170,000 depth estimate points or approximately 9,100 3D line segments, each attributed with high-quality geometric, stratigraphic, and ancillary data. The depth estimate points are formatted for compliance with Geoscience Australia’s (GA) Estimates of Geological and Geophysical Surfaces (EGGS) database, the national repository for standardised depth estimate points. </div><div>Results from these interpretations provided support to stratigraphic drillhole targeting, as part of the Delamerian Margins NSW National Drilling Initiative campaign, a collaboration between GA’s EFTF program, the MinEx CRC National Drilling Initiative and the Geological Survey of New South Wales. The interpretations have applications in a wide range of disciplines, such as mineral, energy and groundwater resource exploration, environmental management, subsurface mapping, tectonic evolution studies, and cover thickness, prospectivity, and economic modelling. It is anticipated that these interpretations will benefit government, industry and academia with interest in the geology of the ERC region.</div>
-
The TCHA18 Data collection covers the model output generated by the Tropical Cyclone Risk Model as part of the assessment. This includes average recurrence interval wind speeds, stochastic track catalogues, wind fields and intermediary data. It also includes an evaluation track catalogue, used to evaluate the performance of the model with respect to historical landfall rates, frequency and track density.
-
<div>Geoscience Australia, together with contributors from the wider Australian seismology community, have produced a new National Seismic Hazard Assessment (NSHA23), recommended for inclusion in proposed updates to Standards Australia’s AS1170.4. NSHA23 builds on the model framework developed for NSHA18, and incorporates scientific advances and stakeholder feedback received since development of that model. Key changes include: further refinement and homogenisation of the earthquake catalogue; revisions to the fault source model through inclusion of newly identified faults and revised activity rates on some faults; assessment of ground motion models through quantitative comparison against observations; and inclusion of a specific ground motion model for shaking from plate-boundary earthquakes in northern Australia. Expert elicitation was used to capture epistemic uncertainty surrounding model choices. The elicitation focused on decision points that sensitivity analysis had shown were more important for hazard, where new models had been developed, and where model choices had been controversial in NSHA18. Key questions included which catalogue to use as the basis for calculating hazard, the weighting of different source model classes (background, regional, seismotectonic, smoothed seismicity and smoothed seismicity with faults), and the selection and weighting of ground motion models for different tectonic regions. NSHA23 hazard results for capital cities show minor changes compared with NSHA18, with the exception of Darwin. Here the ground motion with a 10% probability of exceedance in 50 years increases significantly, a result that is attributed to inclusion of a new, more realistic ground motion model for plate-boundary earthquakes in this unique tectonic setting.</div><div><br>This paper was presented to the 2023 Australian Earthquake Engineering Conference 23-25 November 2023 (https://aees.org.au/aees-conference-2023/)</div>
-
<div>The wind hazard climate in South East Queensland is a combination of tropical cyclones, thunderstorms and synoptic storms. This dataset provides estimated average recurrence interval (ARI) or annual exceedance probability (AEP) wind speeds over the region, based on an evaluation of observational (thunderstorms and synoptic winds) and simulated data (tropical cyclones). </div><div><br></div><div>The tropical cyclone wind hazard was evaluated using Geoscience Australia's Tropical Cyclone Risk Model (TCRM), which provides a spatial representation of the AEP wind speeds arising from tropical cyclones. Thunderstorm wind hazard was evaluated from analysis of observed wind gusts across South East Queensland, aggregated into a single 'superstation' to provide a single representative hazard profile for the region.</div><div><br></div><div>The resulting combined wind hazard estimates reflect the dominant source of wind hazard in South East Queensland for the most frequent events (exceedance probabilities greater than 1:50) is thunderstorm-generated wind gusts. For rarer events, with exceedance probabilities less than 1:200, TC are the dominant source of extreme gusts. </div><div><br></div><div>Local effects of topography, land cover and the built environment were incorporated via site exposure multipliers (Arthur & Moghaddam, 2021), which are based on the site exposure multipliers defined in AS/NZS 1170.2 (2021).</div><div><br></div><div>The local wind hazard maps were used to evaluate the financial risk to residential separate houses in South East Queensland.</div><div><br></div><div>Wind speeds are provided for average recurrence intervals ranging from 1 year to 10,000 years. No confidence intervals are provided in the data. </div>